Tracking the CrISIS in Syria
Posted on 22/09/2014 by Jakub Langr
Posted in technical
If you are interested more in the analysis of the conflict from a quantitative persective and not so much in the methodology, you can jump straight there.
As I was working as a contractor this summer, I came across a very interesting project called GDELT -- Global Database of Events, Language and Tone. This project I think is best described by the official website statement: "GDELT Project monitors the world's broadcast, print, and web news from nearly every corner of every country in over 100 languages and identifies the people, locations, organizations, counts, themes, sources, and events driving our global society every second of every day, creating a free open platform for computing on the entire world."
In addition to that, as a part of Good Judgement Project, I was made to forecast on Syria and ISIS' actions. As I was going through the articles describing what is happening in Syria, I became to wonder: what is the bigger picture? To what extent is this hype all just because now ISIS is the headline-grabber in the West? (But of course, no one cares until it becomes a story in the public consciousness.) That's when GDELT comes into the picture. I wanted to try it as I came across it, but since I was finishing my data science project, I did not quite have the time. I was awe-struck by the complexity and potential of it so I knew I wanted to give a go. I have not really used R all that extensively in about a year since my internship, but I am not afraid of large analytics, so I decided to refresh those skills.
Fortunately, Google was so nice as to host this almost 100 GB dataset on its cloud for free, for which I love Google. Not only that, but Google also loaded this dataset so that it can be queried using BigQuery using public-facing APIs or a web interface. We can then query GDELT using SQL-like language as shown below and subsequently export the dataset as a CSV:
SELECT * FROM [gdelt-bq:full.events] WHERE (
(MonthYear>=201303 && Year<=2015) && NumSources>=2 && GoldsteinScale<0.0 AND
((Actor1Geo_CountryCode=="SY" && (Actor1Code=="IMG" || Actor1Code=="REB"))
|| (Actor2Geo_CountryCode=="SY" && (Actor2Code=="IMG" || Actor2Code=="REB")) )
) ORDER BY Year;
(For those interested, I include a smaller version of the dataset I was working with after exporting from GDELT here.)
The assumption of this endeavor is that if I include non-English media (and perhaps the less main-stream ones too) by using GDELT's information rather than Google, which will always give me traditional sources, I can get a better sense of what is going on. Thanks to the the law of large numbers, I should not get too many false positives from spurious sources, so my overall analysis should remain robust and even more objective than relying on sources such as CNN or BBC alone. One additional advantage GDELT has is that it is updated every 24 hours. In theory, this analysis could be automated so that it updates itself every 24 hours. (Actually, it should not be that much more work ... but given the size of GDELT, I would have to start paying for using the BigQuery service that often.)
As with any more substantive project, there was a lot of data cleaning and obstacles. Namely:
- ISIS not recognized by GDELT: There's lots of International Militarized Groups (IMGs) recognized by GDELT, but ISIS seems to be too new in the headlines to be recognized by GDELT coding yet. Hence I had to look for substitutes:
- IMG (International Militarized Group) tag to the rescue: There is a column specifying actor type (not actor name!) for each event. There is an actor type IMG, which was fortunate. However, there is no way of fully knowing whether said group is ISIS or not from this dataset. (At least with this level of granularity, but I am sure it would be technically possible, if GDELT team so chose.) I would also imagine that the fighters on the ground themselves are often not quite sure, given the number of splinter groups these organizations harbor.
- But sometimes "REB": When individually inspecting the events (just some of them, I do not have the time to go through the entire data dump), I quickly realized that the data pertaining to clearly ISIS attacks are sometimes labeled as "REBEL" actor type. So I needed to include both in the analysis.
- Cleaning the data: For some events it is hard, if not impossible, to correctly specify precise coordinates. As a result, GDELT merely inputs the values of the approximate center of Syria. These records obviously needed to be removed from the dataset. Obviously, there was couple of more steps that I needed to do and a couple that tricked me for a little bit, for instance, when I found that the state code of one of the events was IS, which, however, stood for Israel, as I later found out.
The GDELT project classifies each event using one of their internal codes, each of these codes then gets then a Goldstein score, which basically expresses whether this event whether people are being nice to each other (positive score) or mean/evil towards each other (negative score). Where +10.0 is some massive humanitarian/developmental aid project, +1.0 is probably visit of some minor national politician. All the positive things were filtered out, because I wanted to focus on what the problems were. There -1.1 is, for instance, "Deny an attributed policy, action, role or position" and -10.0 is "Military attack; clash; assault".
As the more SQL-knowledgeable of you might have noticed, I only considered events that came from 2 independent sources and happened on or after March 2013.
Let's explore
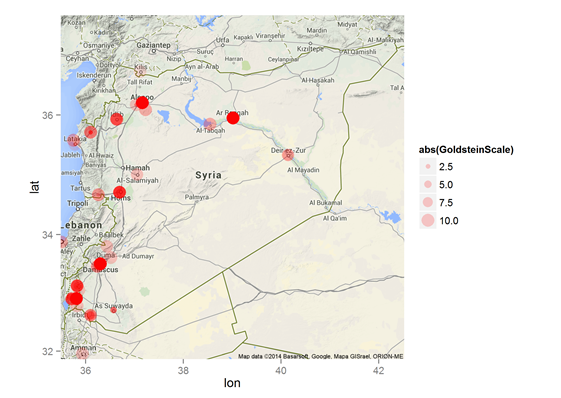
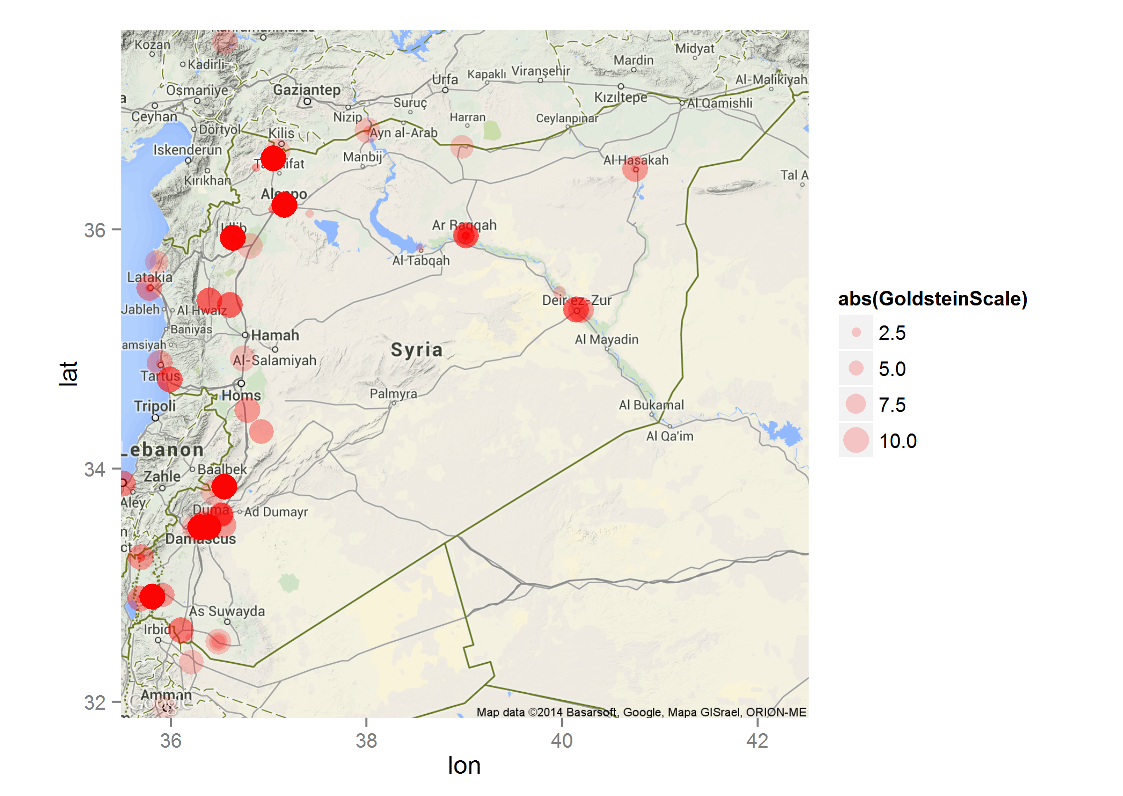
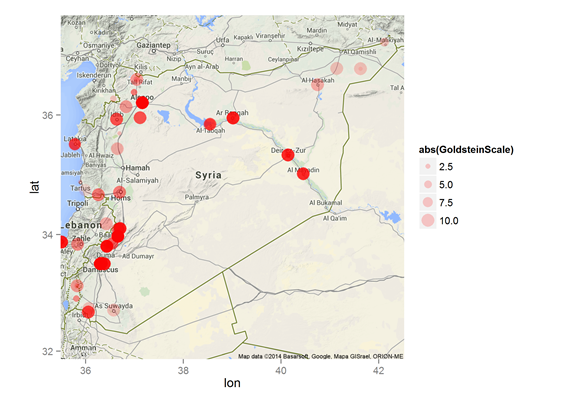
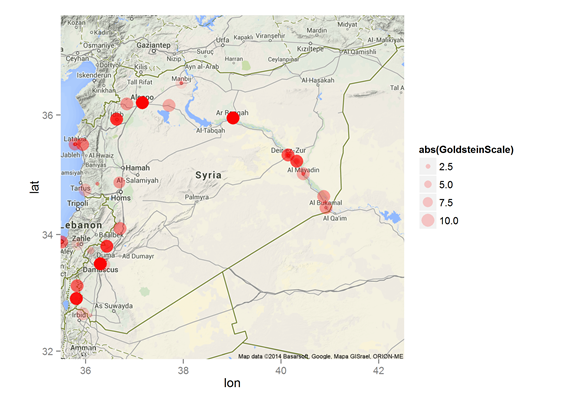
With this dataset in hand, I made several maps where I plotted each event as a point sized according to its Goldstein score and set relatively low transparency so that all hotspots appear in bright red. I plotted this dataset by month, and here's March 2013 till July 2013. We see that at the end of this period, there's was violence spearing from its initial hotspots.
March and April 2013
 |
 |
May and July 2013
 |
 |
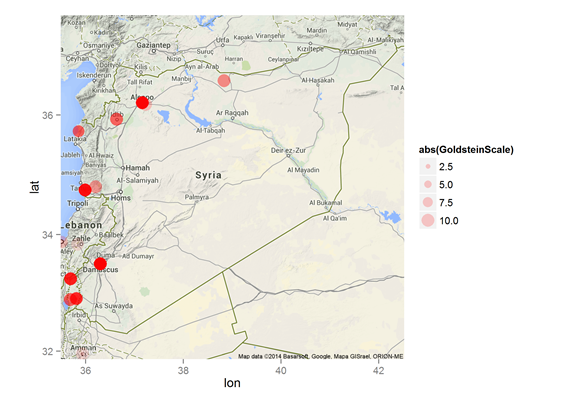
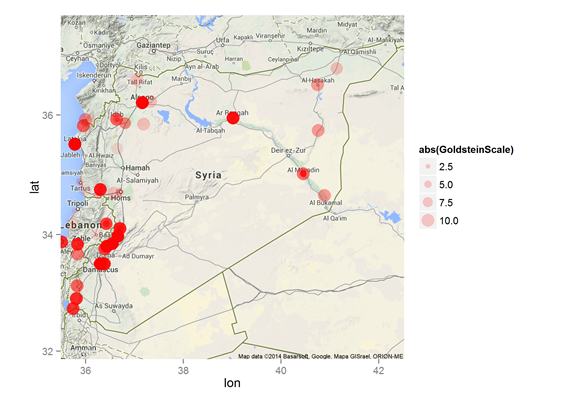
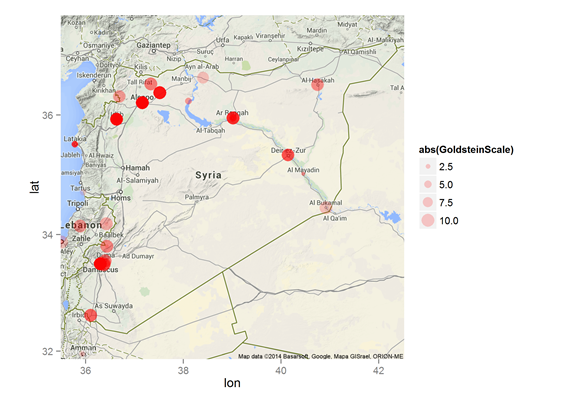
Now, if we look at the period August till November, we see that there's a lot more violence then. But to some extent we have to bear in mind that this dataset includes all rebels and not just ISIS.
August 2013
September 2013
October 2013
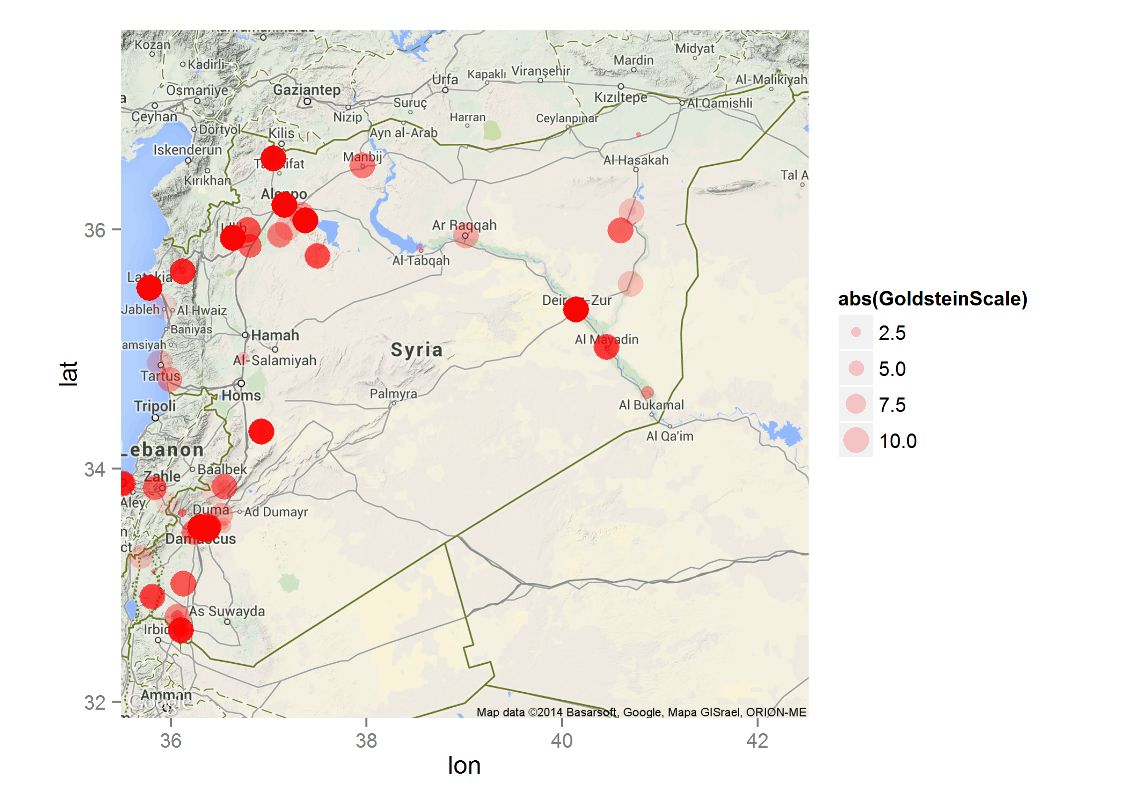
November 2013

Moreover, we have to consider the connected events:
Here, I am using Google Trends as a proxy for "Western interest" in the matter. We can see that the use of chemical drew Western attention to Syria, however, this interest was very short-lived.
Clearly, August and September are easily explained by the usage of chemical weapons. But the violence following this, especially in October and later, cannot be explained just by looking at chemical weapons, because that is when the hype ended and has not picked up until ISIS was the next important thing.
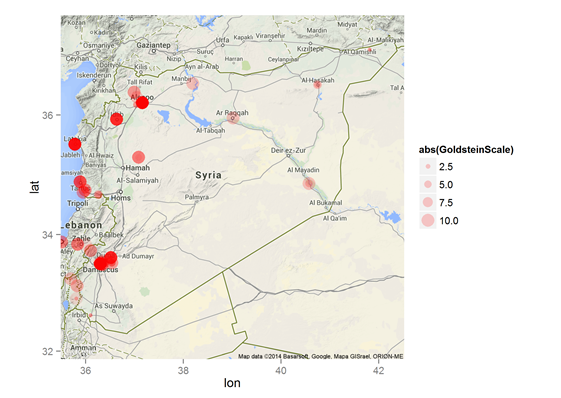
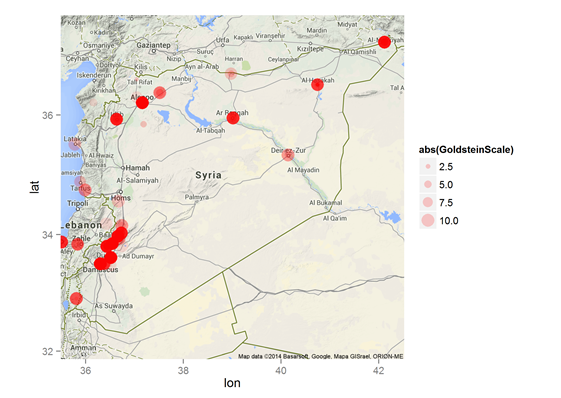
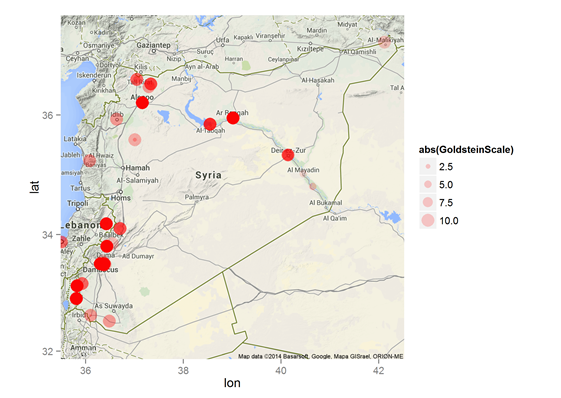
The following months were similarly violent and few in the West seemed to care.
December 2013 and January 2014
 |
 |
February and March 2014
 |
 |
April and May 2014
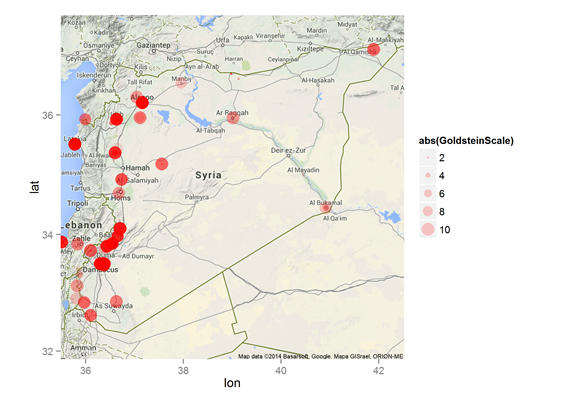 |
 |
If we plot the Google trend graph again, since the start of Syrian Civil War in March 2011, we see that the attention Syria got around the times of the use of chemical weapons is unparalleled. This is hardly surprising, but what is notable is that there a disagreement regarding who actually used them, though I think that at least some of these attacks were sure to be made by the government.
But despite the limited interested by the West, violence was actually similar to the months during which the chemical weapons were used.
What is interesting that ISIS was not picked up by Western media much until recent months, despite the fact that ISIS can be traced back to 2004:
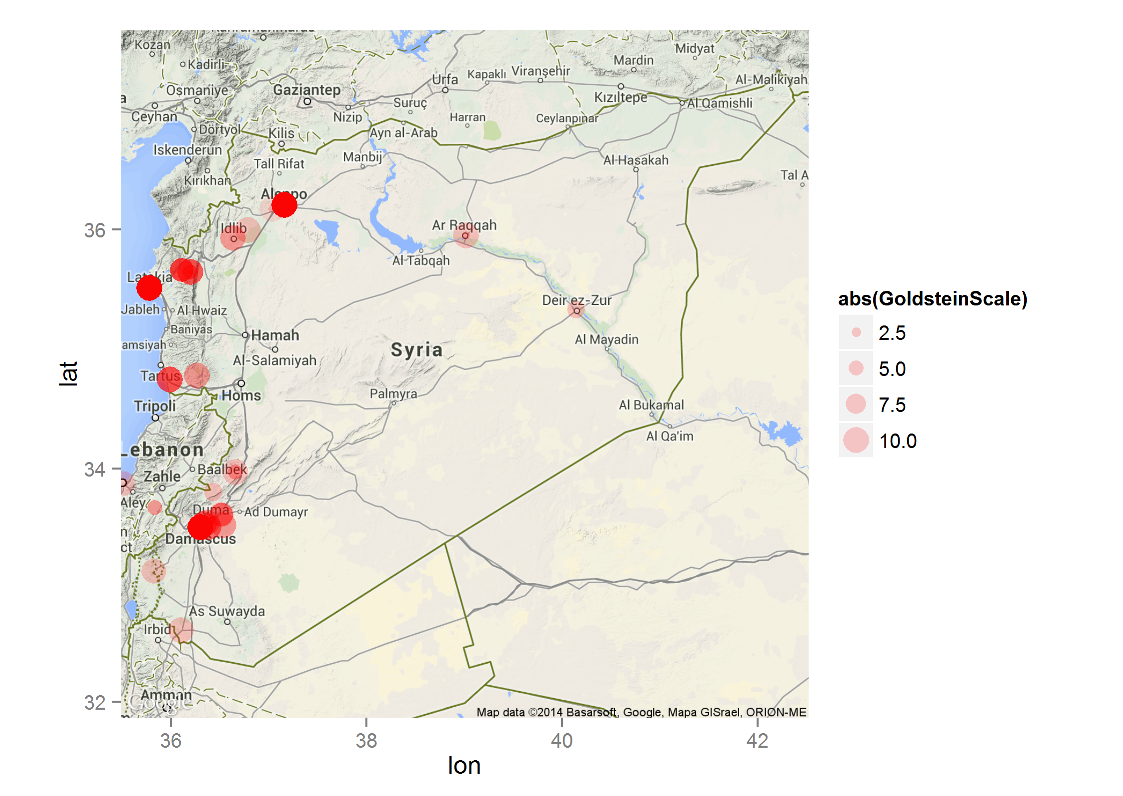
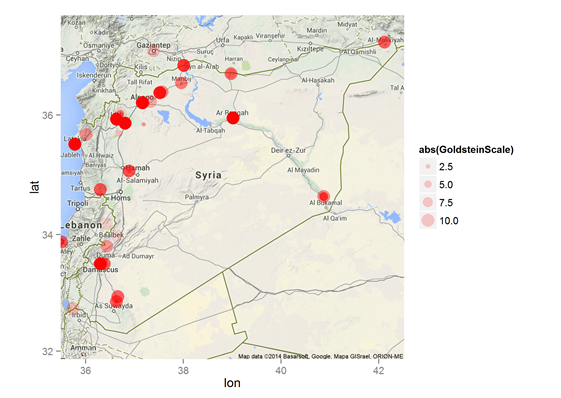
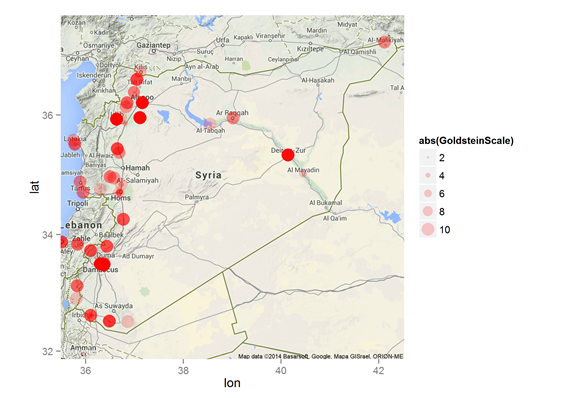
Still, violence was hovering around the same level:
June and July 2014
 |
 |
August and September 2014
 |
 |
Conclusion
It is interesting that it seems that despite the limited budget that ISIS has for its media operations, its terror tactics are largely successful: Syria is not, at least by according to this analysis, by and large, more violent than it was in the few months prior to ISIS' inclusion in the Western media's limelight. Yet, ISIS get substantial amount of attention, so much so that it prodded United States and five Arab states (no European states, however, at the time of writing) to launch a military operation starting today. This article used a lot of proxies so I do not want to make grandiose claims that cannot be supported by this analysis.
Nevertheless, I think what this article shows that ISIS first and foremost is unparalleled by its usage of social media compared to other terrorist organiztations and splinter groups. If anything, it seems that the number of violent occurrences has decreased. But the terror-tactics and the headline-grabbing strategy of ISIS is already working well for them. West pays attention.
At the same time, the brutality and the casualities is hard to really compare, because the information about the previous comparable systems (e.g. Islamic Emirate of Afghanistan) is very limited and we might just never get as complete picture as we have now. But now, largely thanks to GDELT, we have a much more complete dataset about the conditions within the Islamic State and so it might prove easier to benchmark the level of violence and discord in this society against all other -- be it present or future -- states.
I am currently working on an interactive R-Shiny app for this visualization/analysis so stay tuned!
Want the R script? Want to give feedback? Comments? Question? I am happy to hear it! Contact me at james [dot] langr [at] gmail [dot] com.
GANs & applied ML @ ICLR 2019
TL;DR: at the bottom. I have just return
AI Gets Creative Thanks To GANs Innovations
For an Artificial Intelligence (AI) professional, or data scientist, the barrage of AI-marketing can evoke very different feelings than for a general audience. For one thing, the AI indu
List of ICML GAN Papers
In all seriousness, however, I do respect greatly all the amazing work that the researchers at ICML have presented. I would not be capable of anywhere near their level of work so kudos to them
Comments